Visualizing the Bay Area
Now, I measure the shadows of Earth
Exhibit & Content Development
Made for The Exploratorium's Observatory
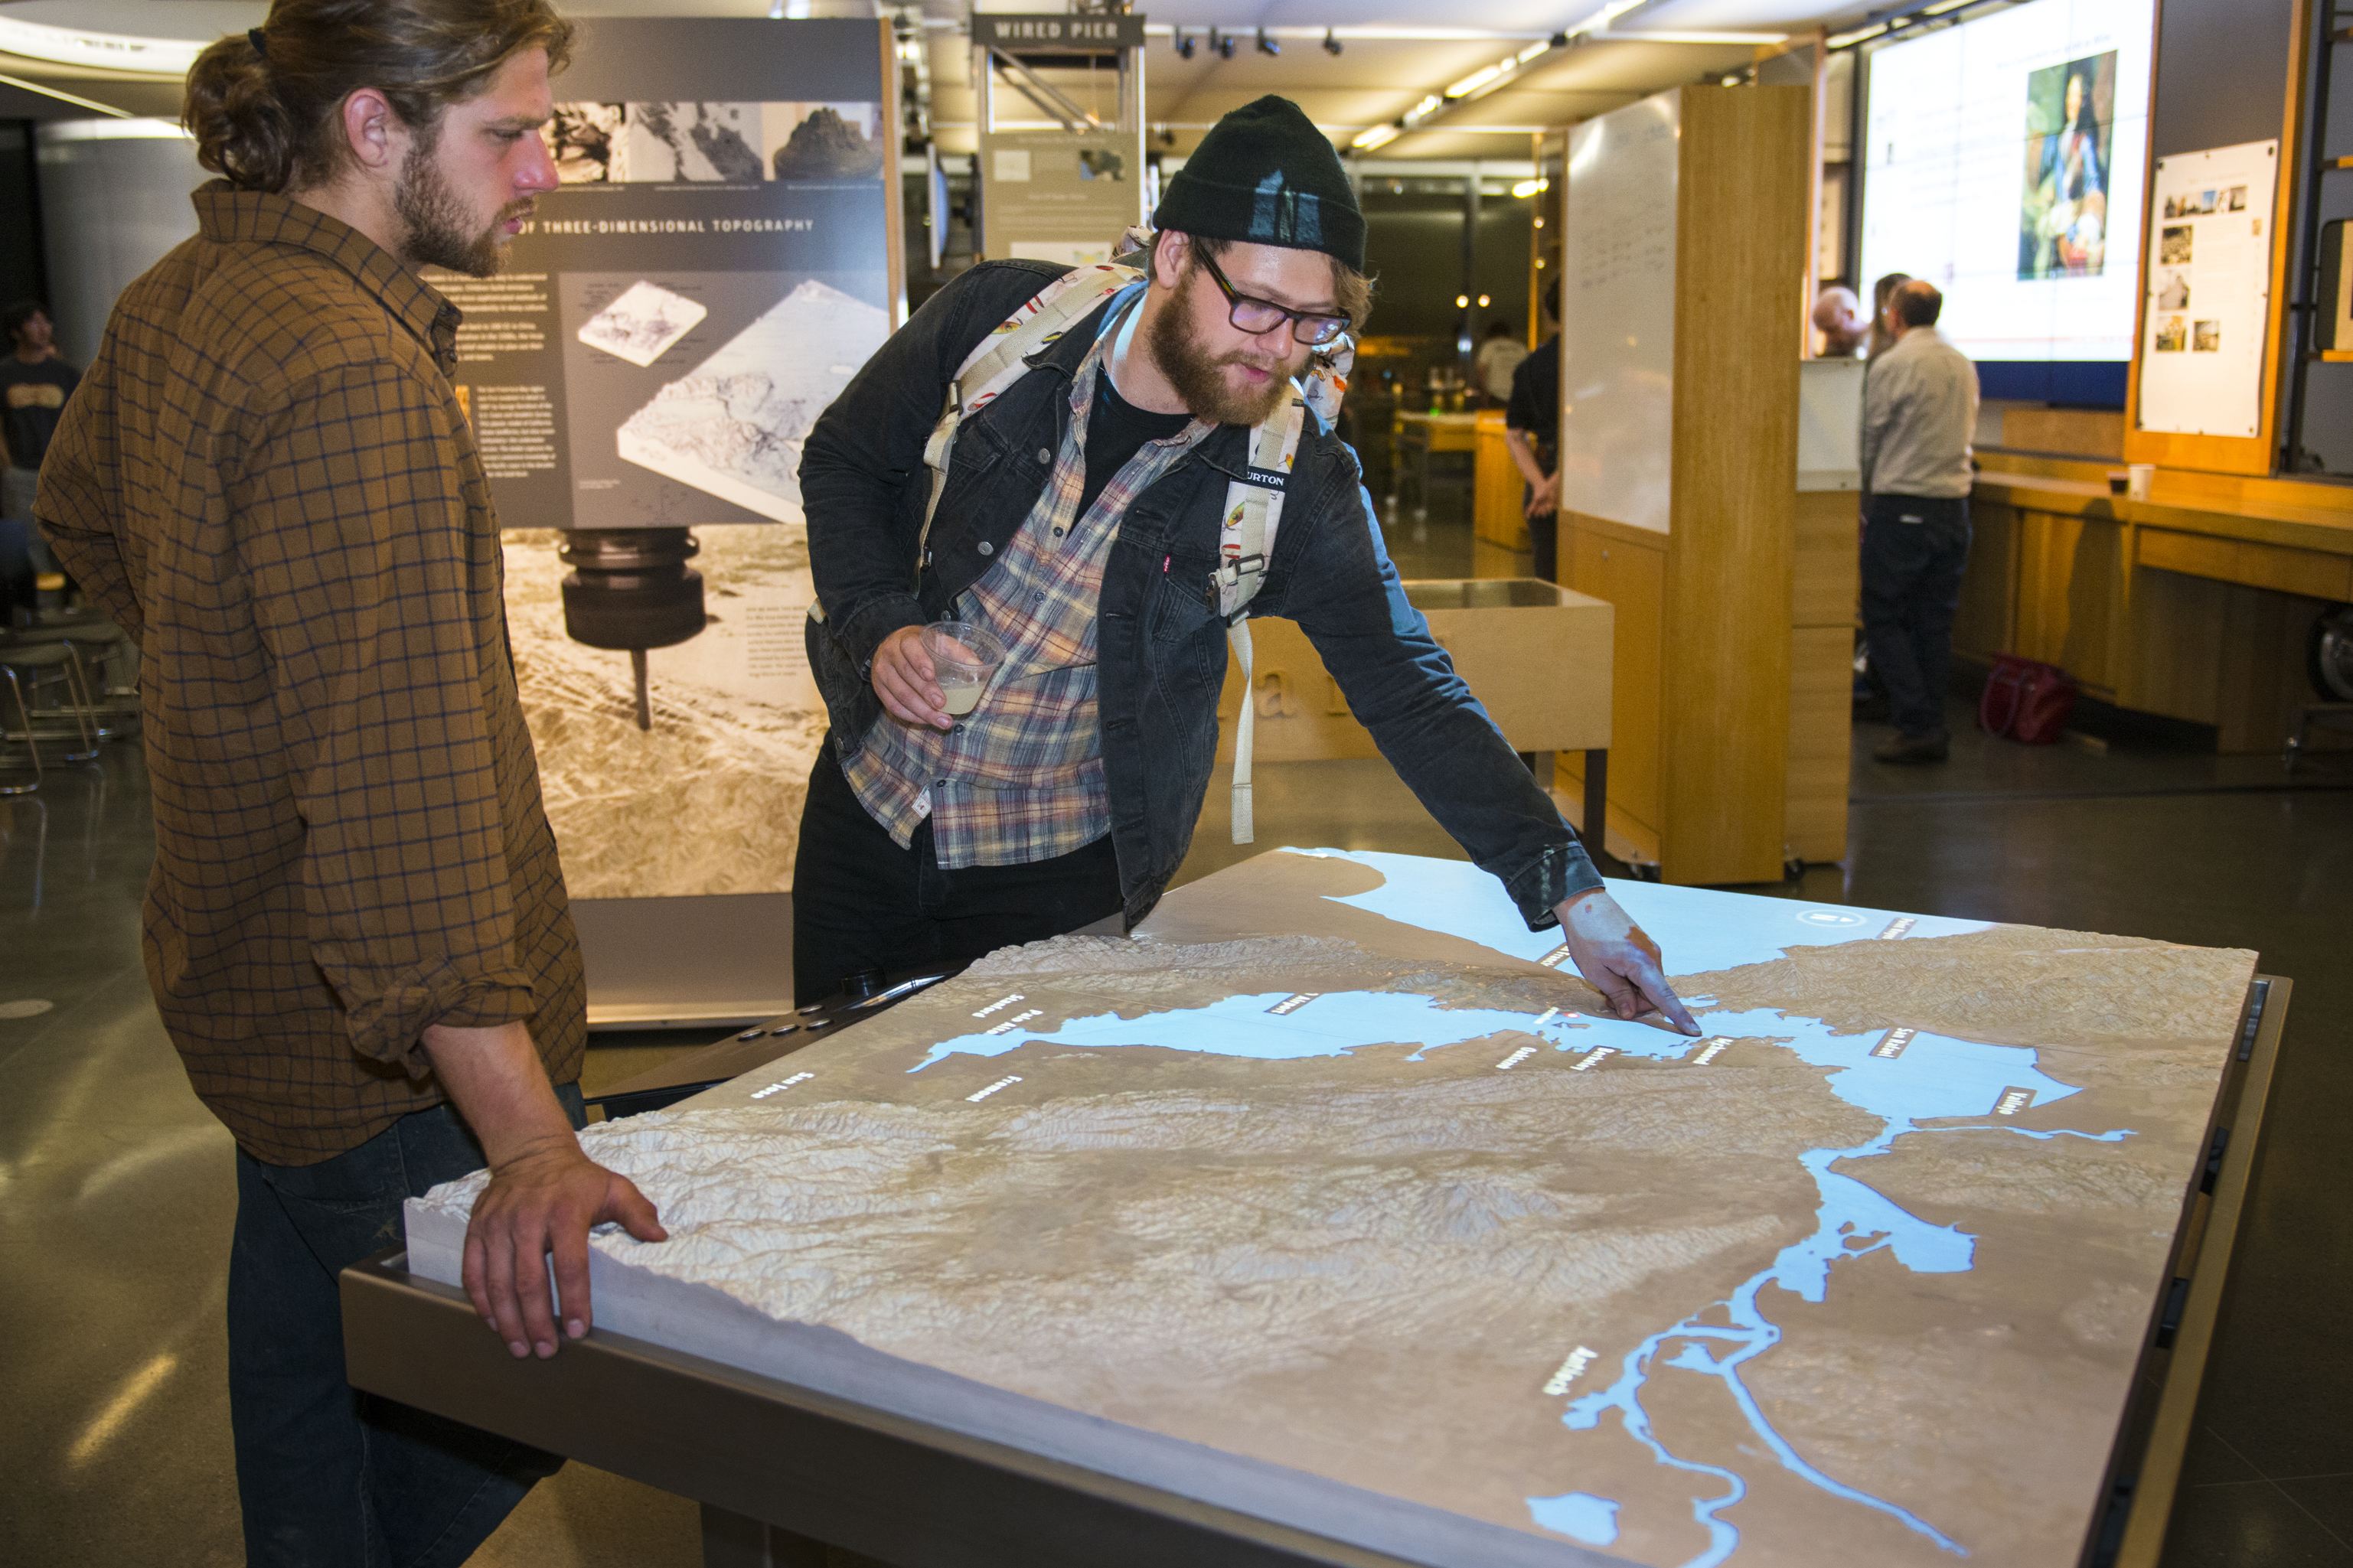
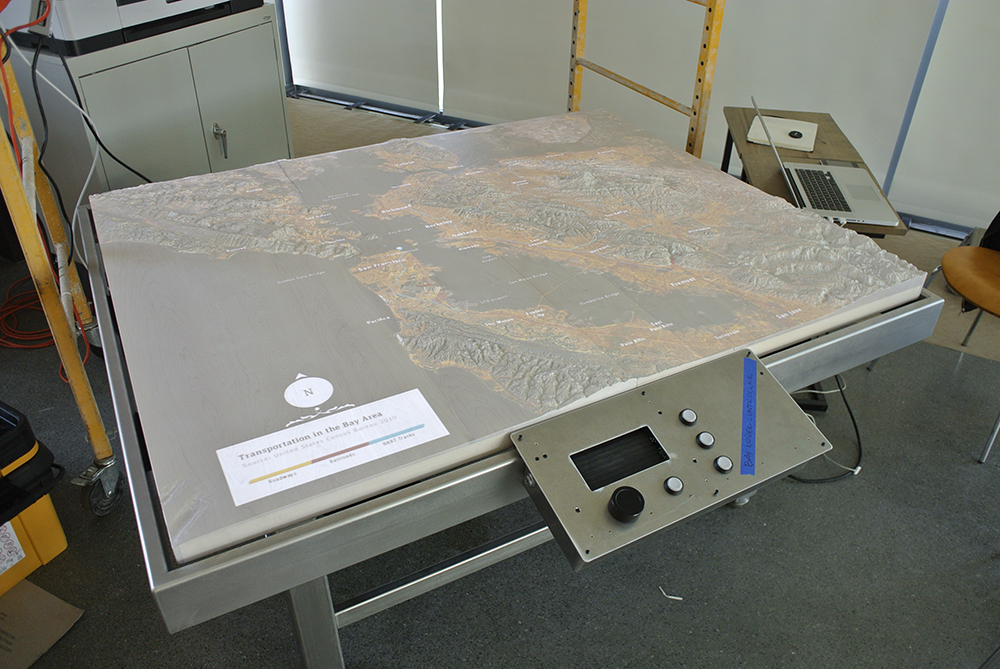
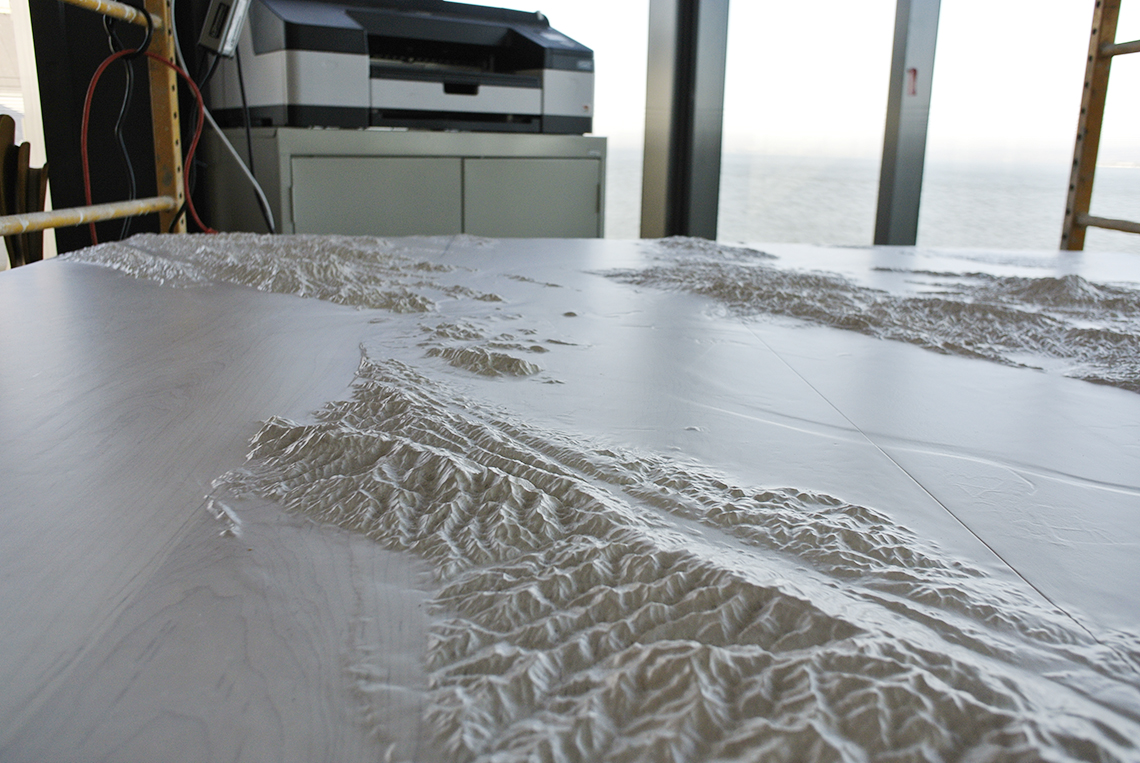
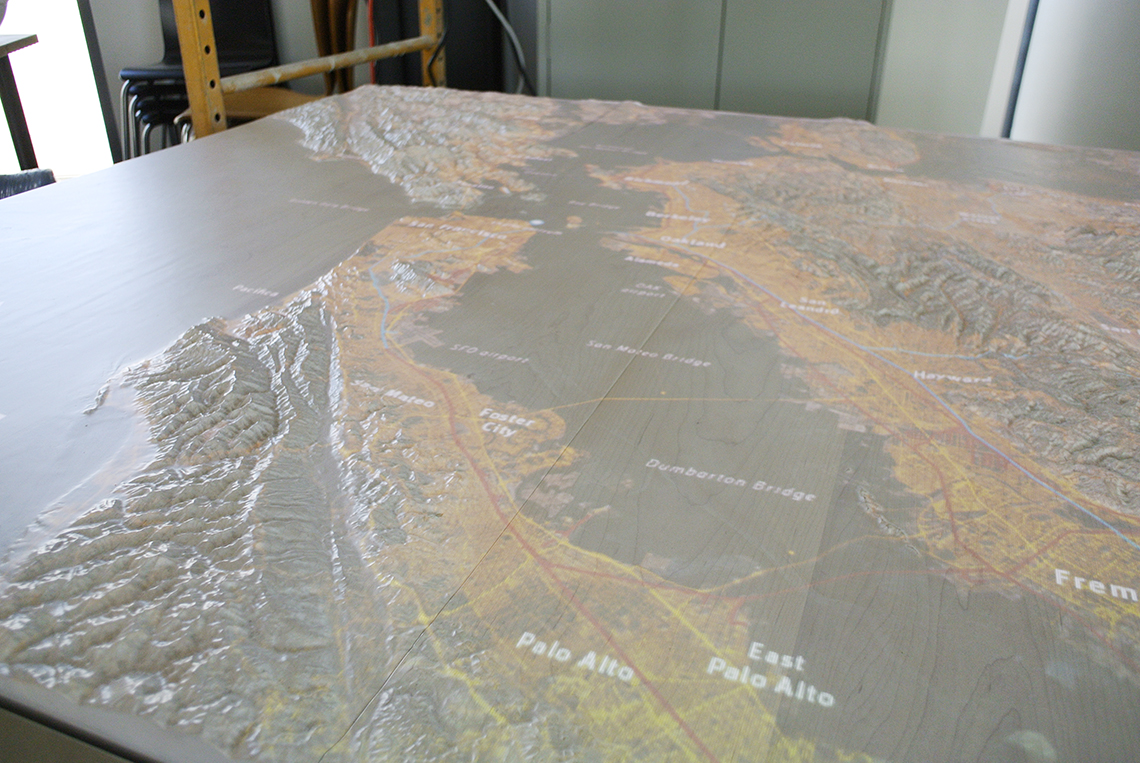
The Bay Area Model is a large topographic impression of the Greater San Francisco Bay Area. The routed maple surface is coated in a white semi-translucent polyurethane, transforming the features of the landscape into a projection surface. A blank slate to view a variety of subjects. e.g. the ebb and flow of our ocean, the currents and patterns of our atmosphere, the geological makeup of the ground beneath our feet and those very forces that pushed it into being.
The Wonder Piers
San Francisco Magazine /

New Exhibit and a new Gallery
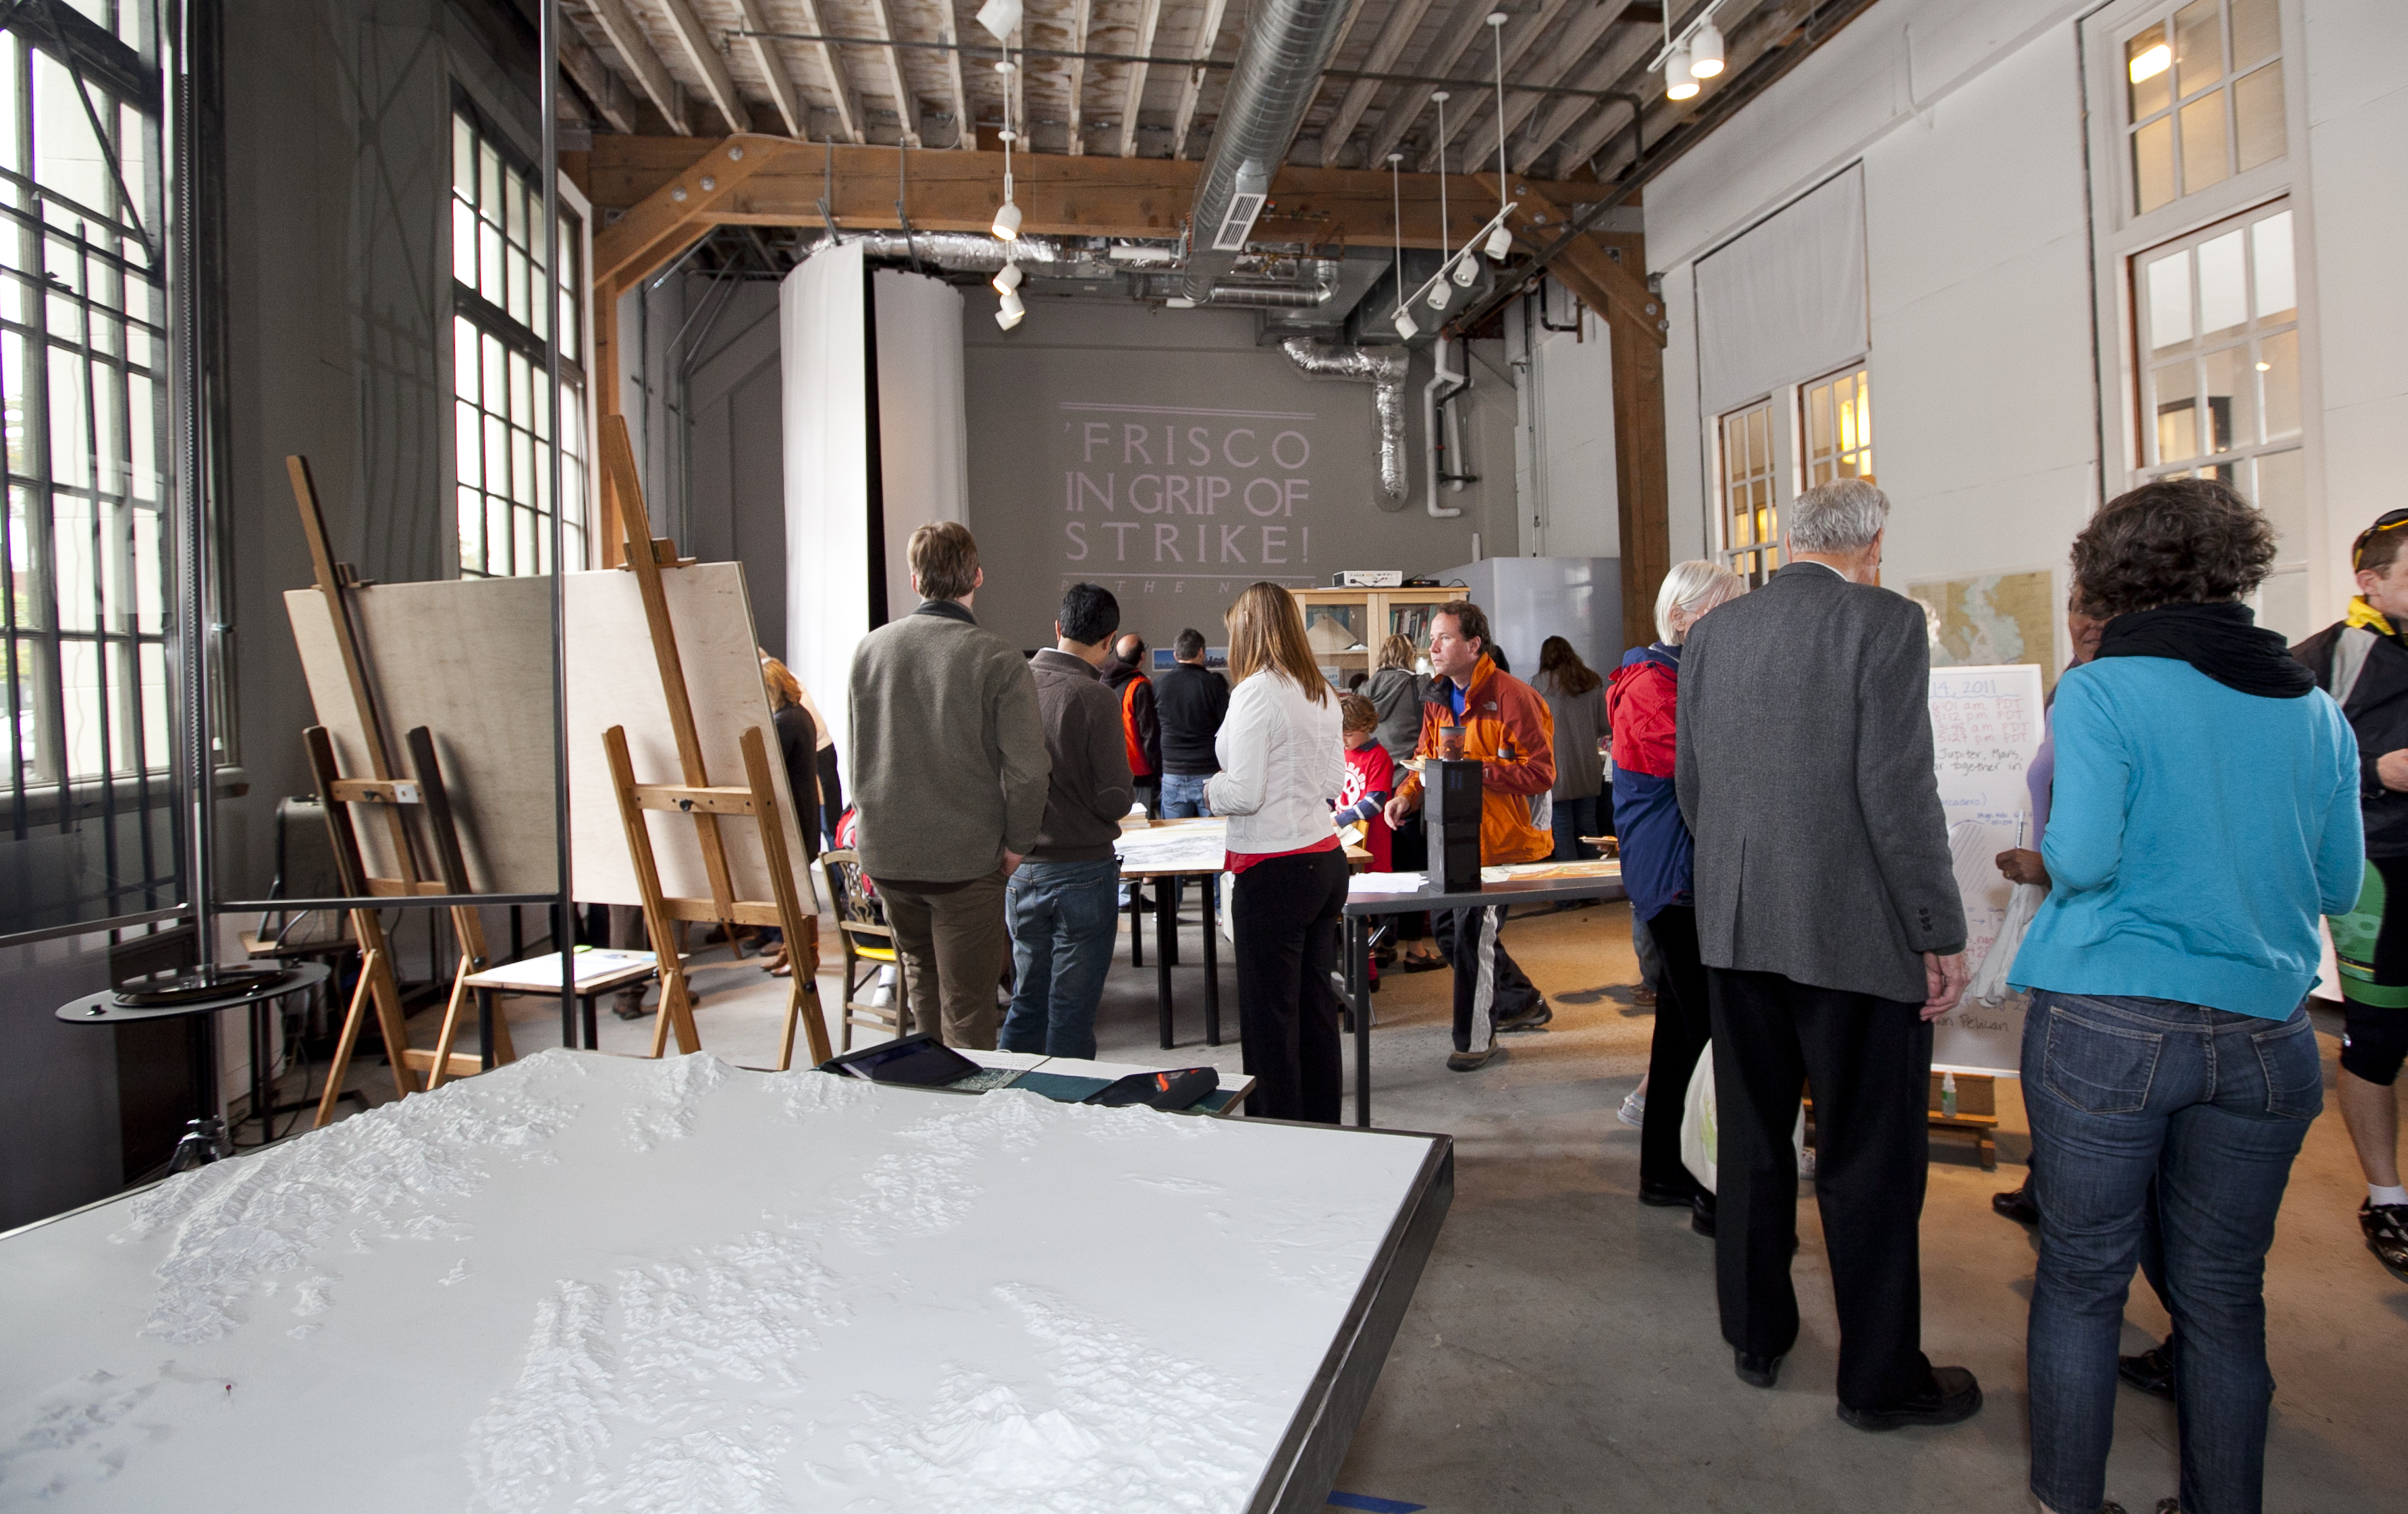
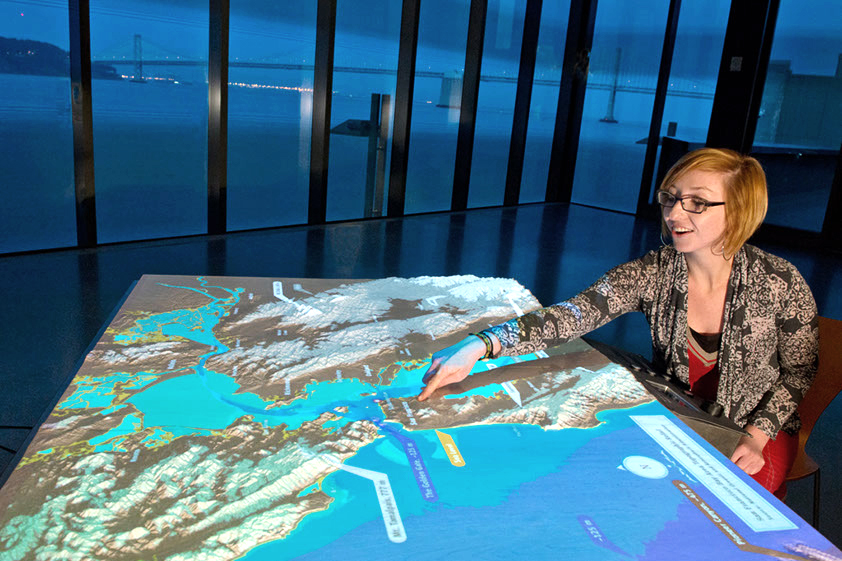
The Observatory Gallery was imagined for the Exploratorium's move to the Embarcadero along San Francisco's bayside waterfront. The gallery is unique in that—for a museum dedicated to learning through hands-on exploration—there was little before it in regards to the long contemplative observational sciences. The Bay Area Model lent itself nicely to this quiet meditative space at the end of our Pier.
Discover invisible processes unfolding across the Bay, the land, and the atmosphere.
An Orientation
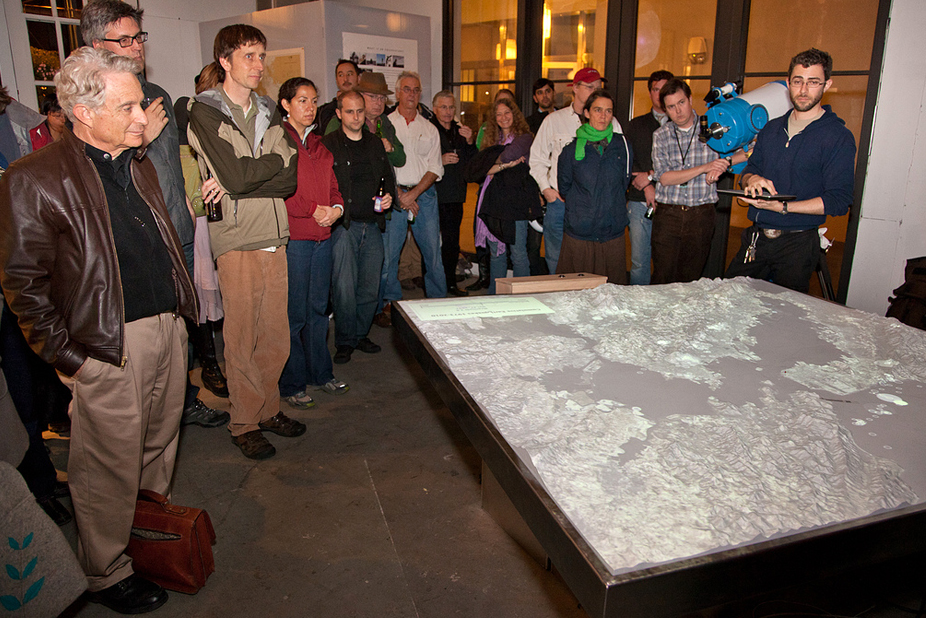
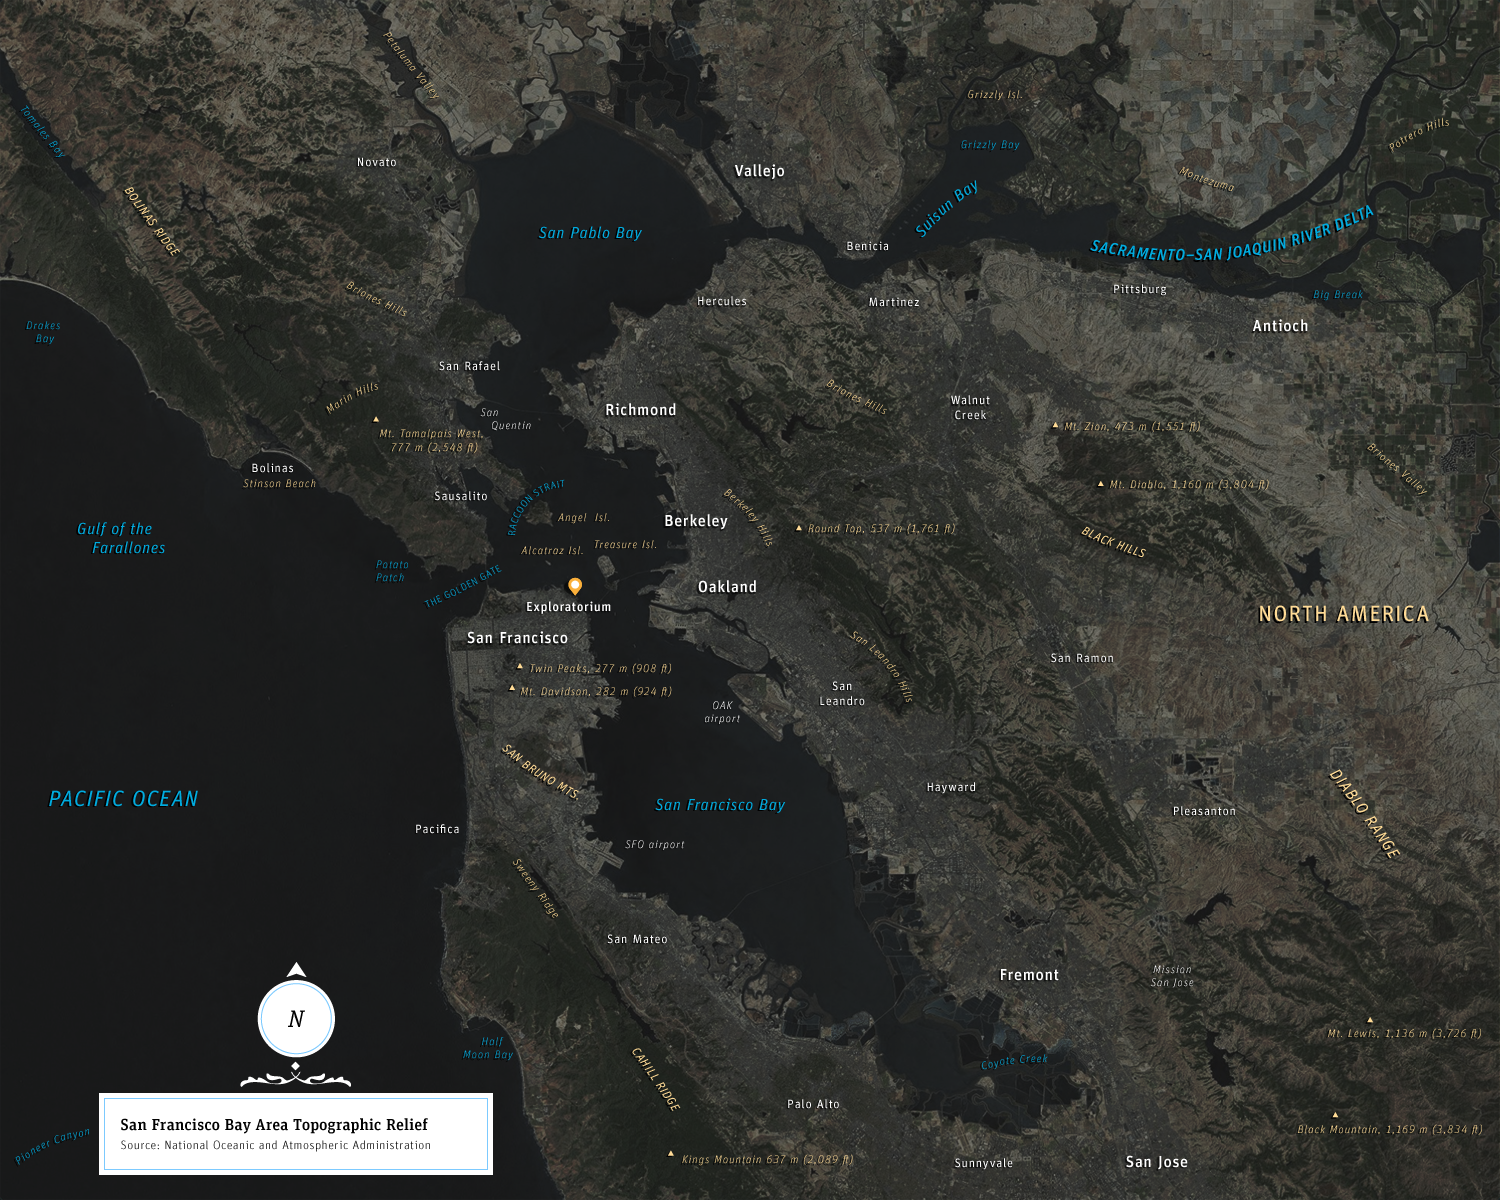
Welcome to the Bay Area Model. In this piece, we were concerned with simply orienting yourself to an area. Now, to Finding Yourself.
How much is necessary to find yourself on a map or in the wilderness jungle itself? What does orienting yourself entail? What's visible plays an important role, how well you might know the area helps, and the cardinal of all orientation, finding North. An Orientation explores a variety of landmarks, from the physical to the imaginary, in varying degrees of detail, to aid in the viewer's comfortable acclimation to the area.
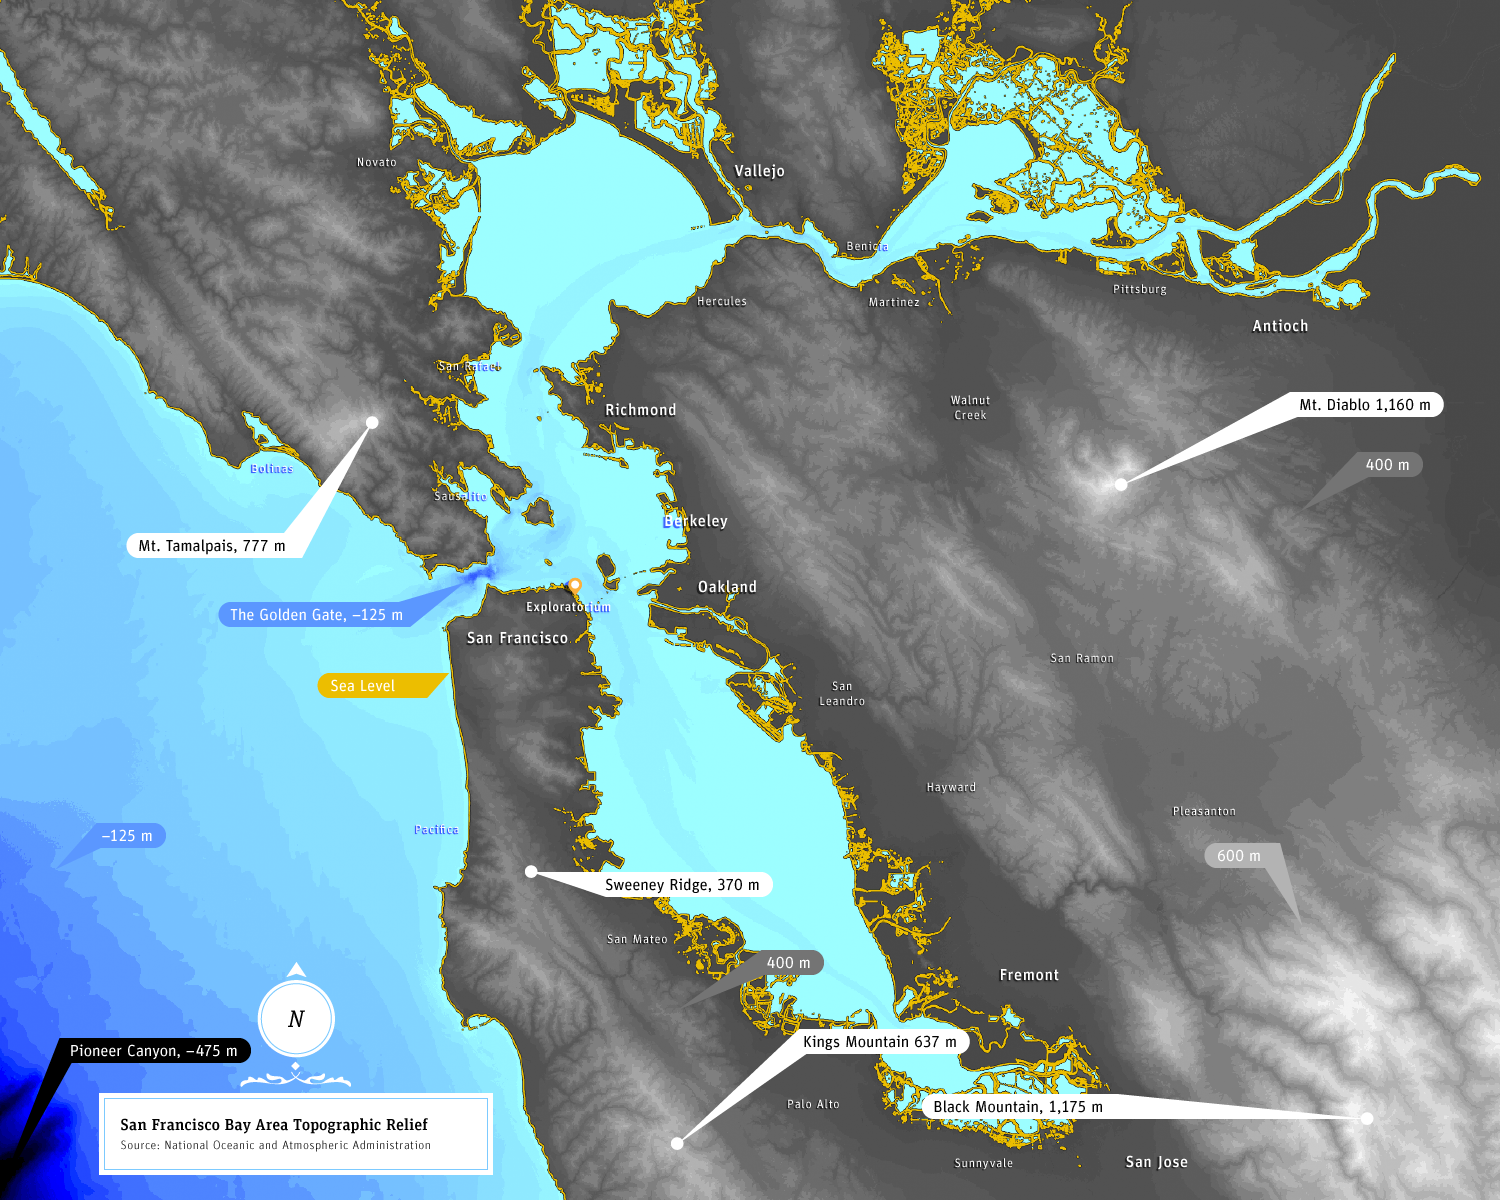
In the literal sense of orienting the visualization starts with our surroundings, with significant markers of the landscape. Beginning with the bodies of water from small to large, from brook to river, to ocean. Then terrestrial bodies come, from valley, to range, to continent. After these, we have our concrete ways across the landscape, influenced by natural or animal paths we have our circuits of trade and settlement. This sequence of introduction is punctuated with all-mighty cardinal point to North. Once concluded the visualization cycles through a sampling of content, other visualizations such as maps, videos, or artistic works. All for the Bay Area Model itself.
For it is never only about the thing itself; it is also about the image one obtains of a thing.
Dynamic Earth
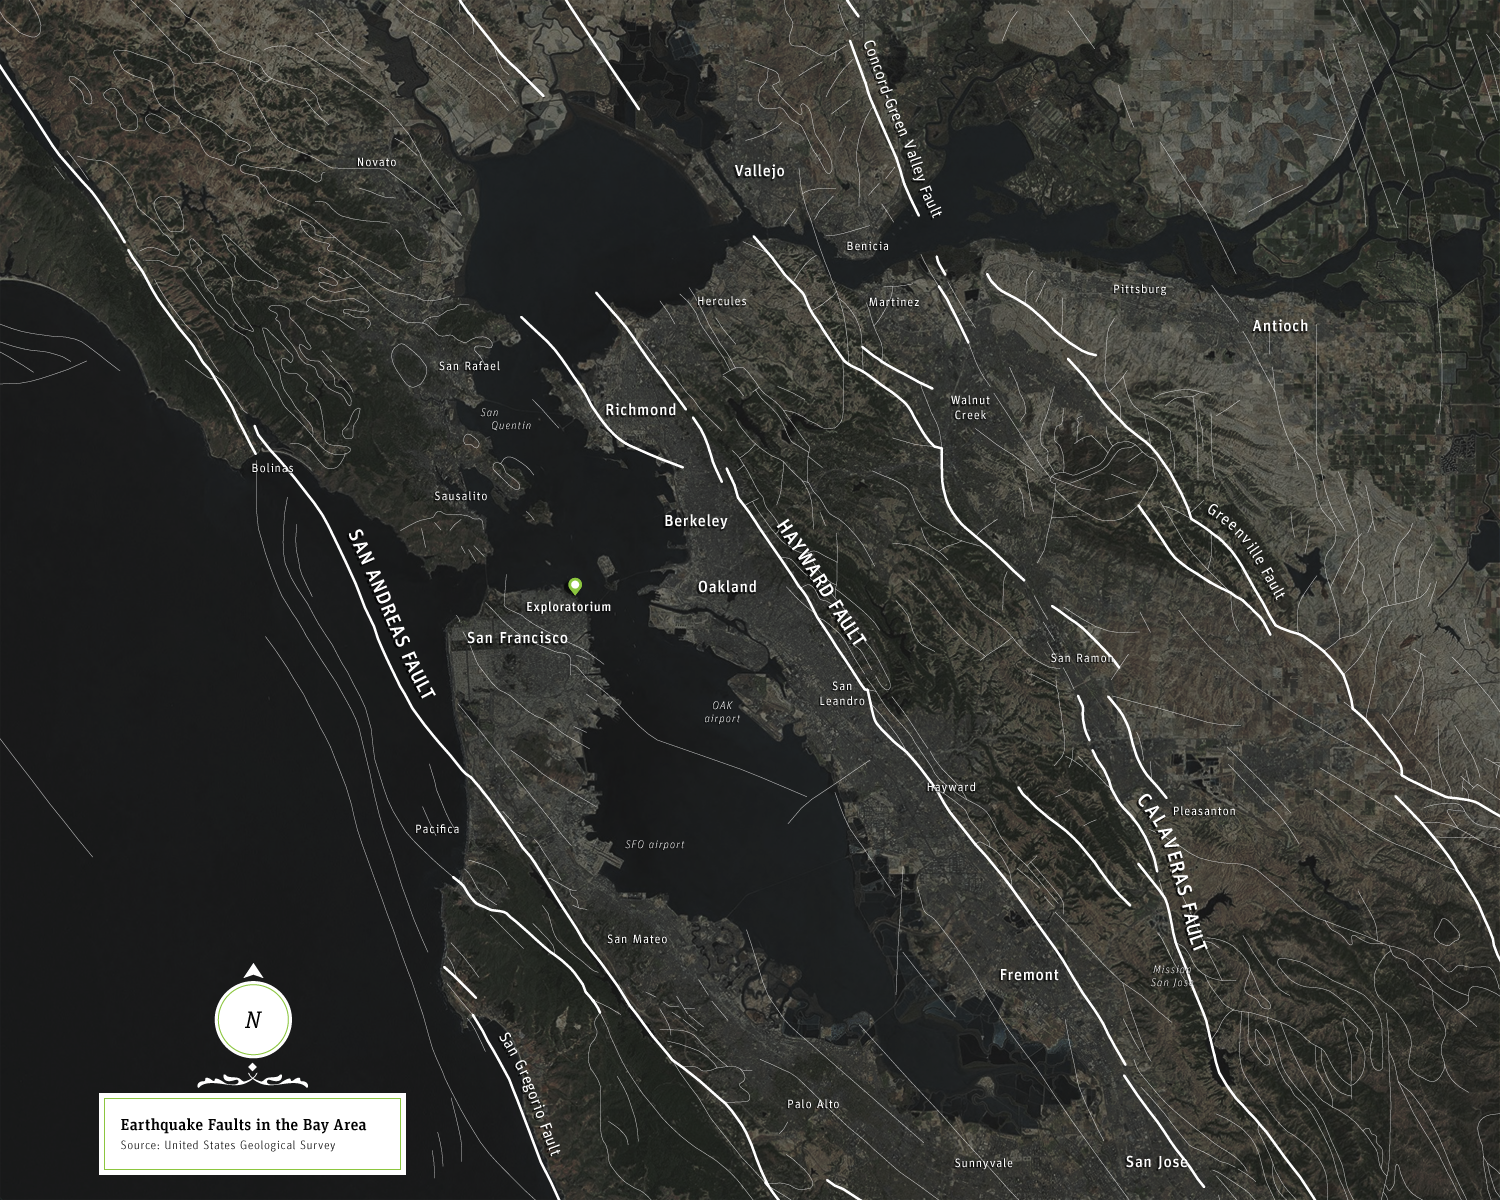
Thousands of years ago in the future, the Earth's fixed surface flee. In this piece, we lent the Model to a Geological study exploring the tectonic boundary with which San Francisco is so intimately acquainted. The San Andreas.
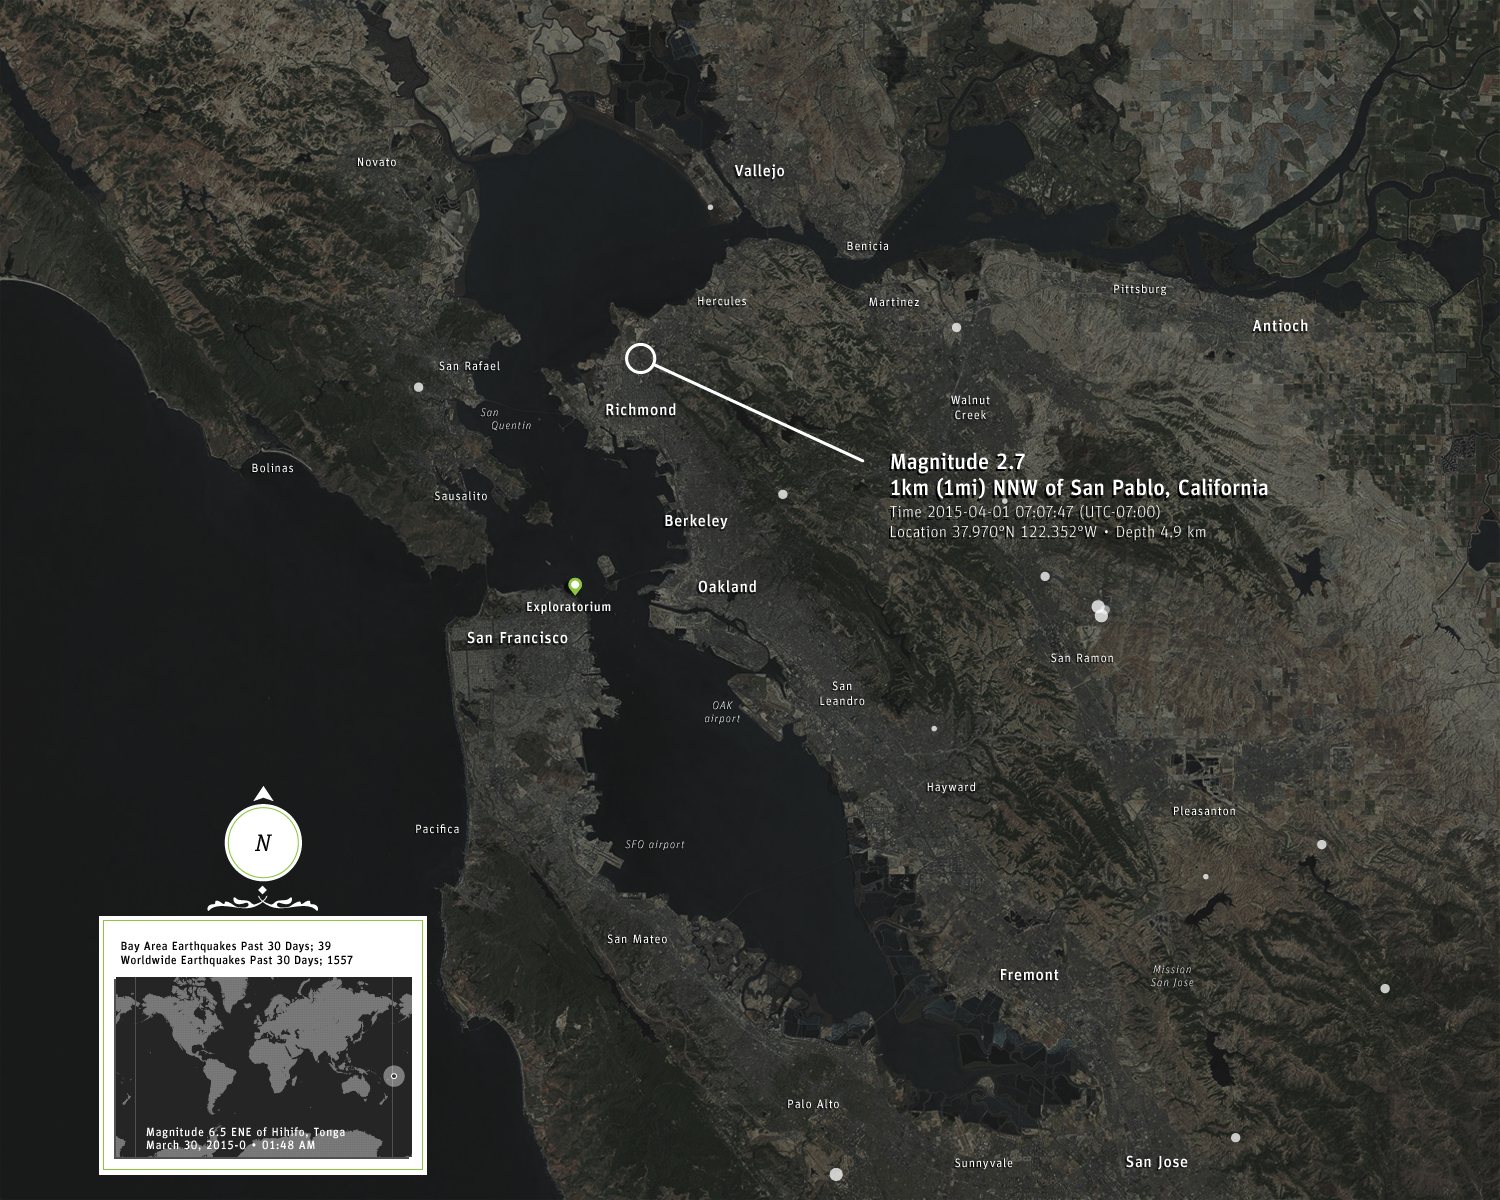
Dynamic Earth is an entry point into the complex forces at work beneath our feet, the very forces that have governed the shaping of our seas and continents. This is made through a glimpse into our local fault system, the geological foundation, and the currents that are constantly forming its beauty. Now, San Francisco is no newcomer to earthquakes, in fact, we've been ravaged by several. And though we hear about large quakes, most above a magnitude 4, we seldom hear of all of the tiny, comparably silent readjustments that happen every hour, all around us. It's a wondrous thought that the stone beneath us—in timescales unfathomable—was formed and shaped like a pliable dough.
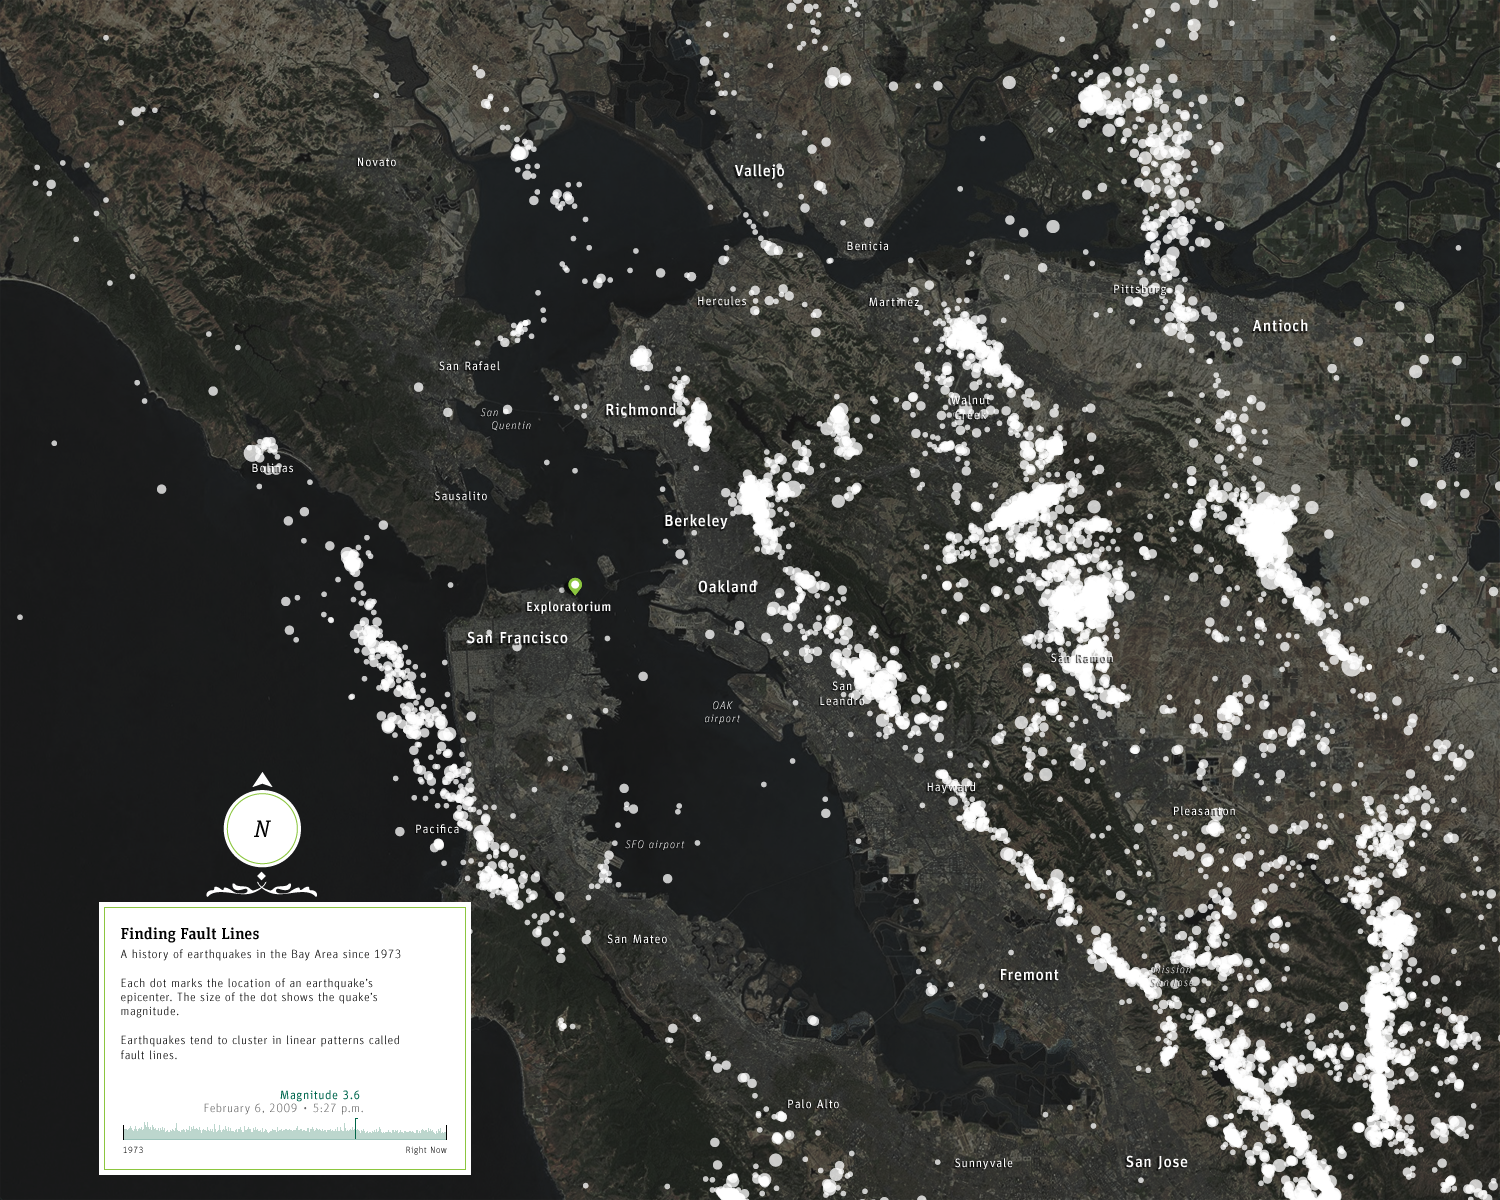
Dynamic Earth is accompanied by a sister piece called Finding Fault Lines. Where Dynamic Earth is a live representation of earthquakes around the world up to the hour, displaying the sheer activity of our earth's surface, that a seemingly static landscape was wrought over time and continues to be formed. Finding Fault Lines is an interactive archive (Geo-located seismic data collected by USGS) that spans from 1973 to the present. The Archive illuminates how early Seismologists were able to deduce the location's fault lines, by measuring and recording earthquake epicenters over a long period of time, they were able to define the areas that corresponded to the faults.
No, the universe is not being pushed from behind, it's being pulled from the future.
The Ground Beneath Us
Civilization exists by geological consent, subject to change without notice. In this visualization, we explore the stability of the ground we've settled and call home.
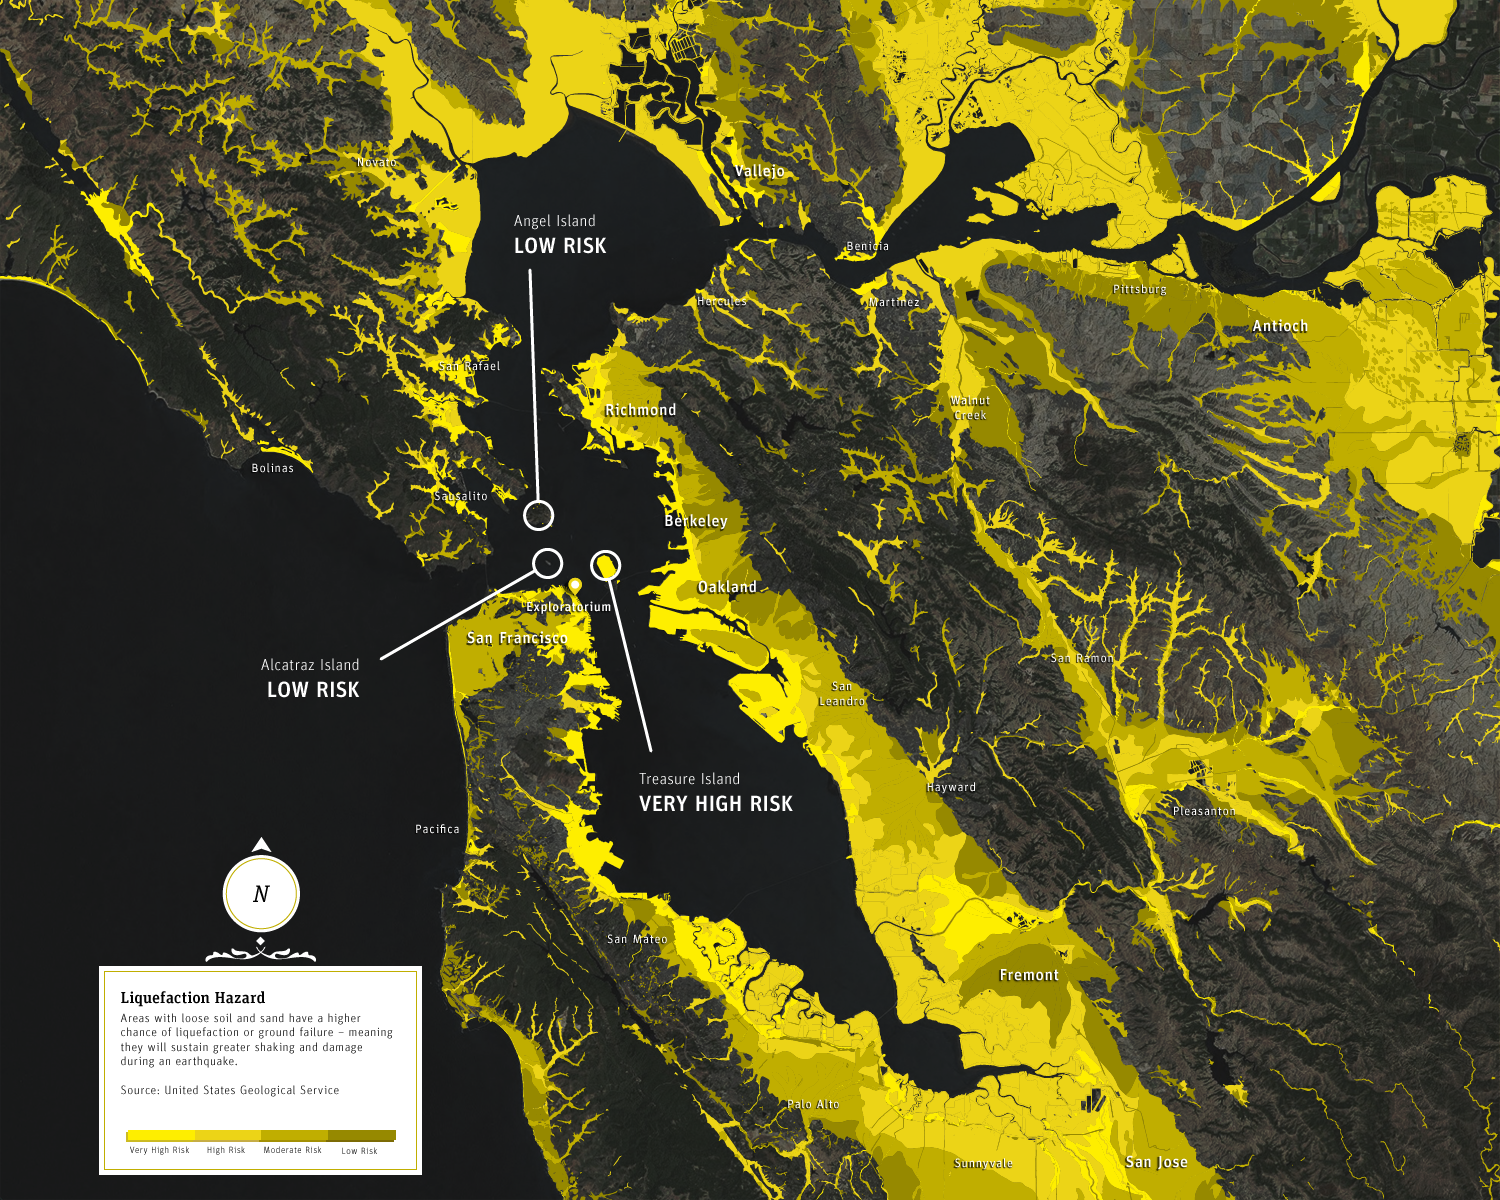
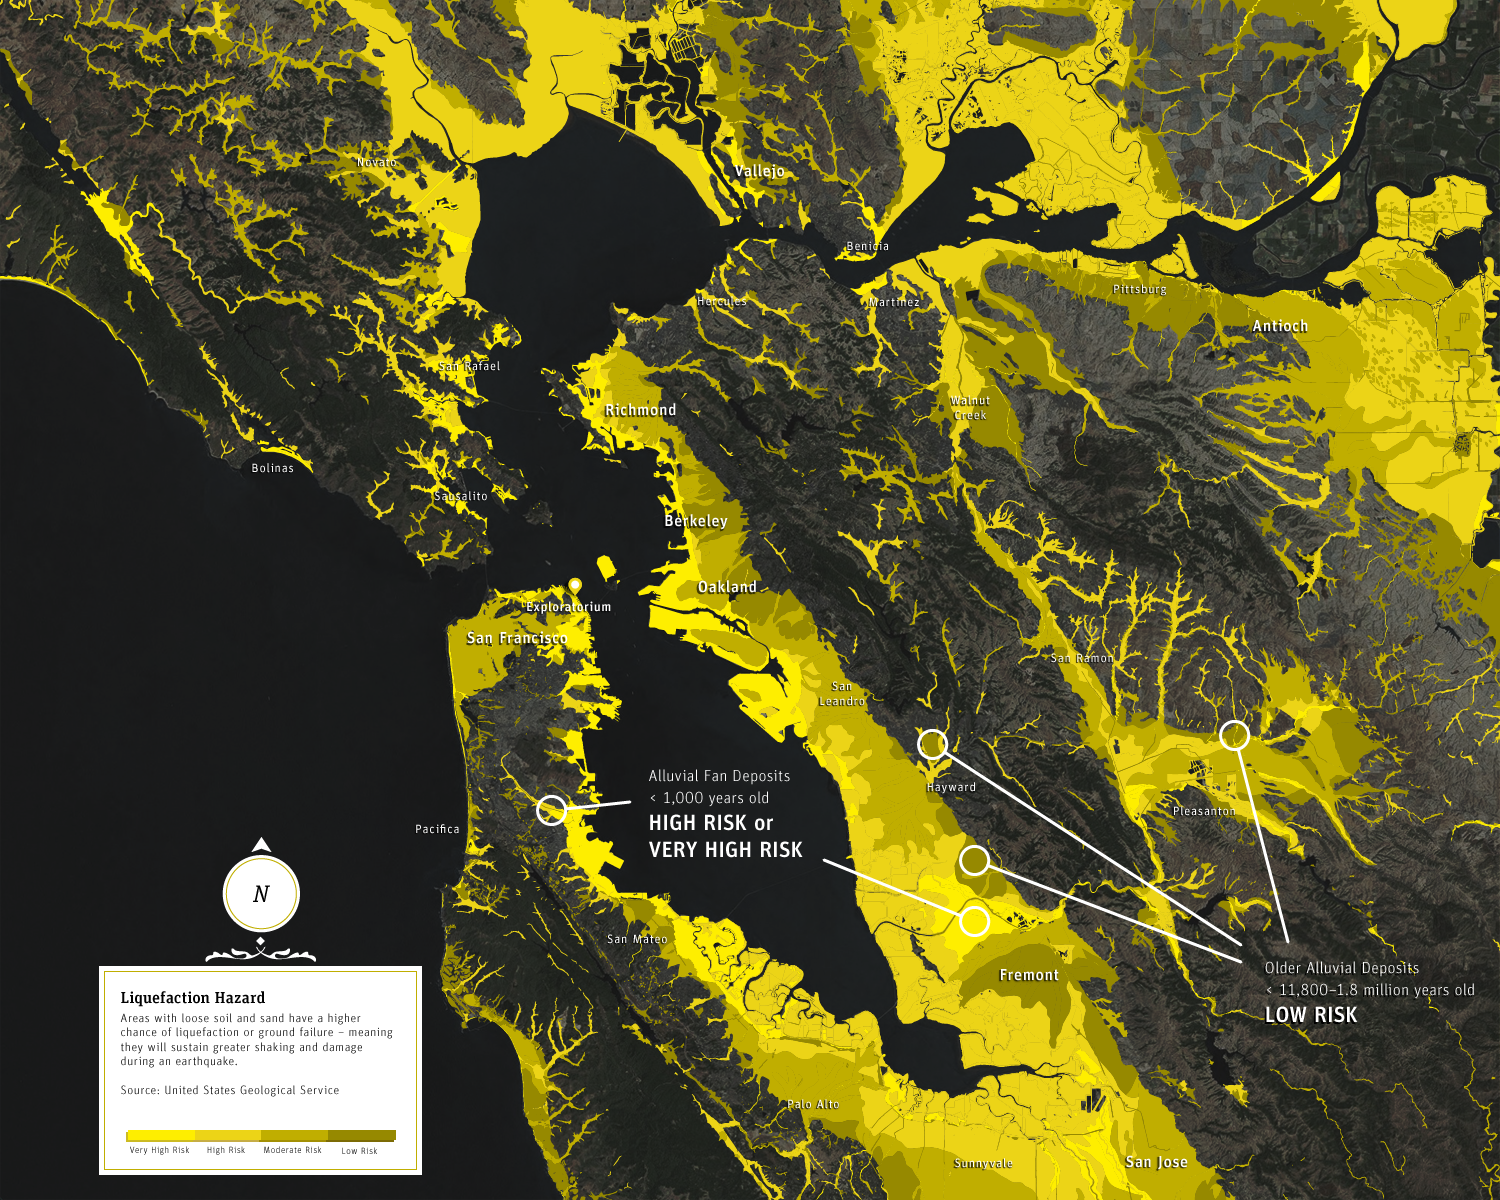
The Ground Beneath Us, or what was later to be called Earthquake Hazards, is a sequence that describes the nature of the ground under us. Geologically the area is a Delta, the product of running water, anything that isn't a mountain or hill is sedimentary in birth. Naturally, we've settled these flat areas, we've also filled much waterfront with sand, or land-fill, to provide us with more land to settle. All of which is subject to liquefaction in a major seismic event. As it goes, we learn geology the morning after the earthquake.
But instead am wandering awed about on a splintered wreck I've come to care for, whose gnawed trees breathe a delicate air.
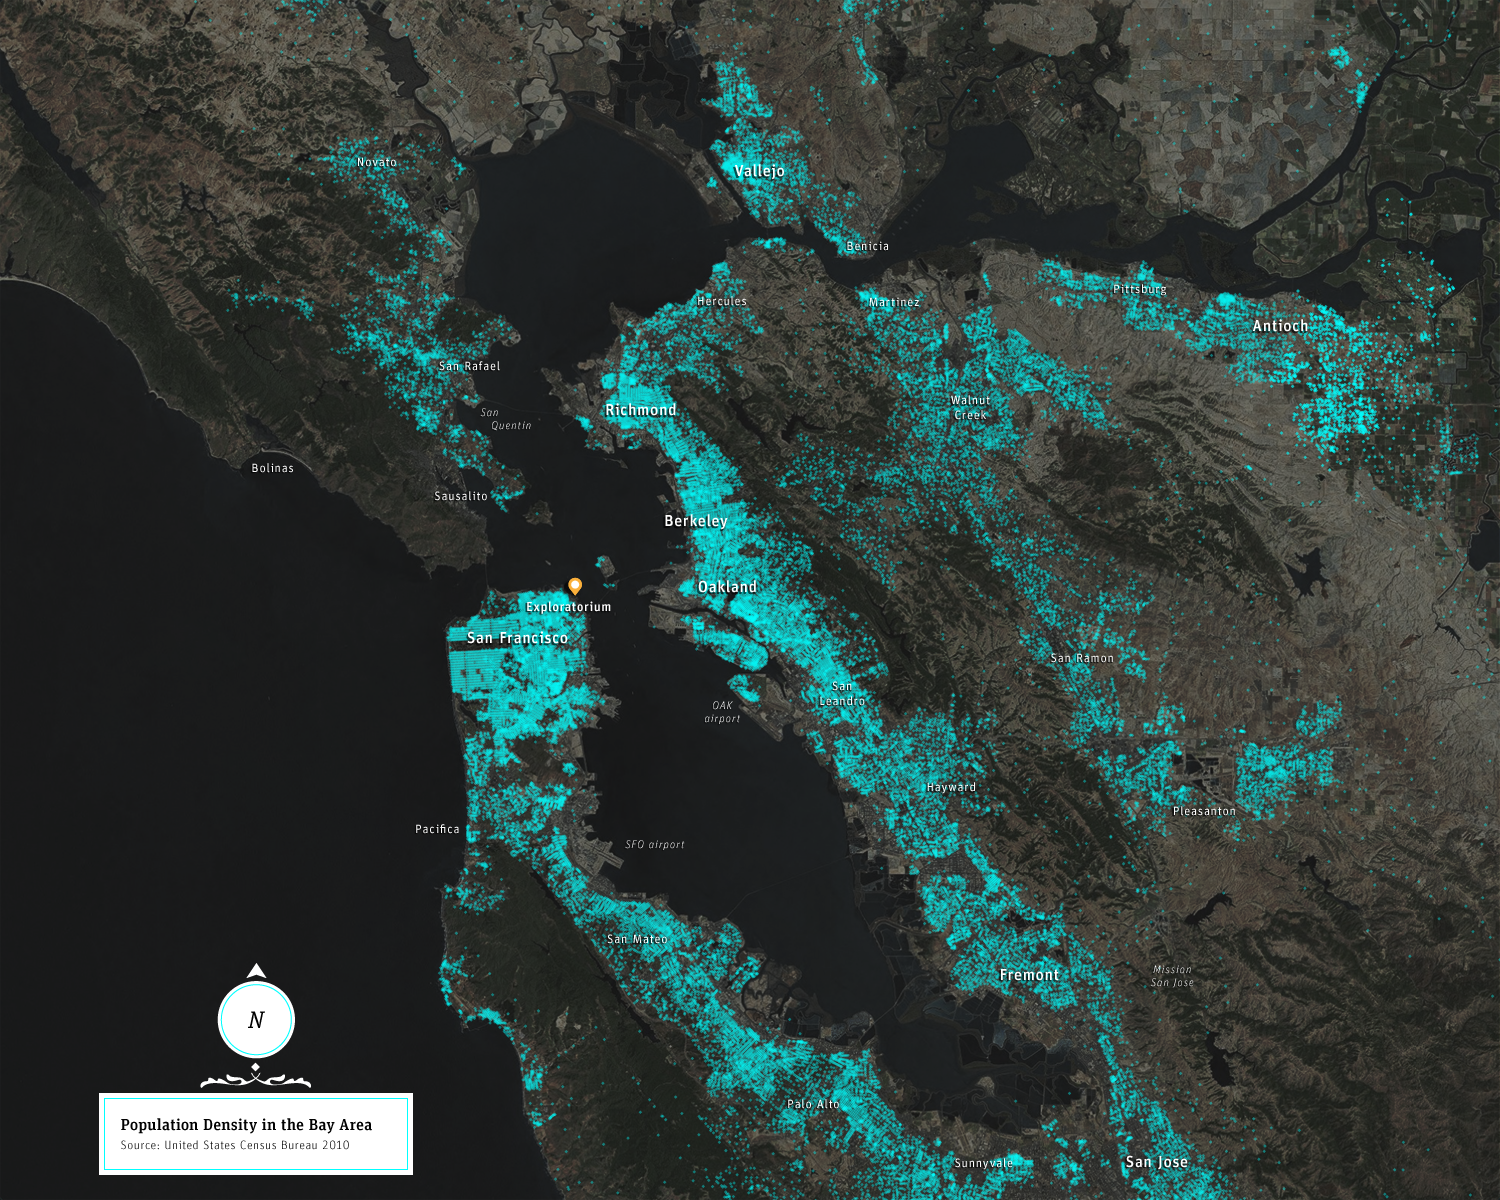
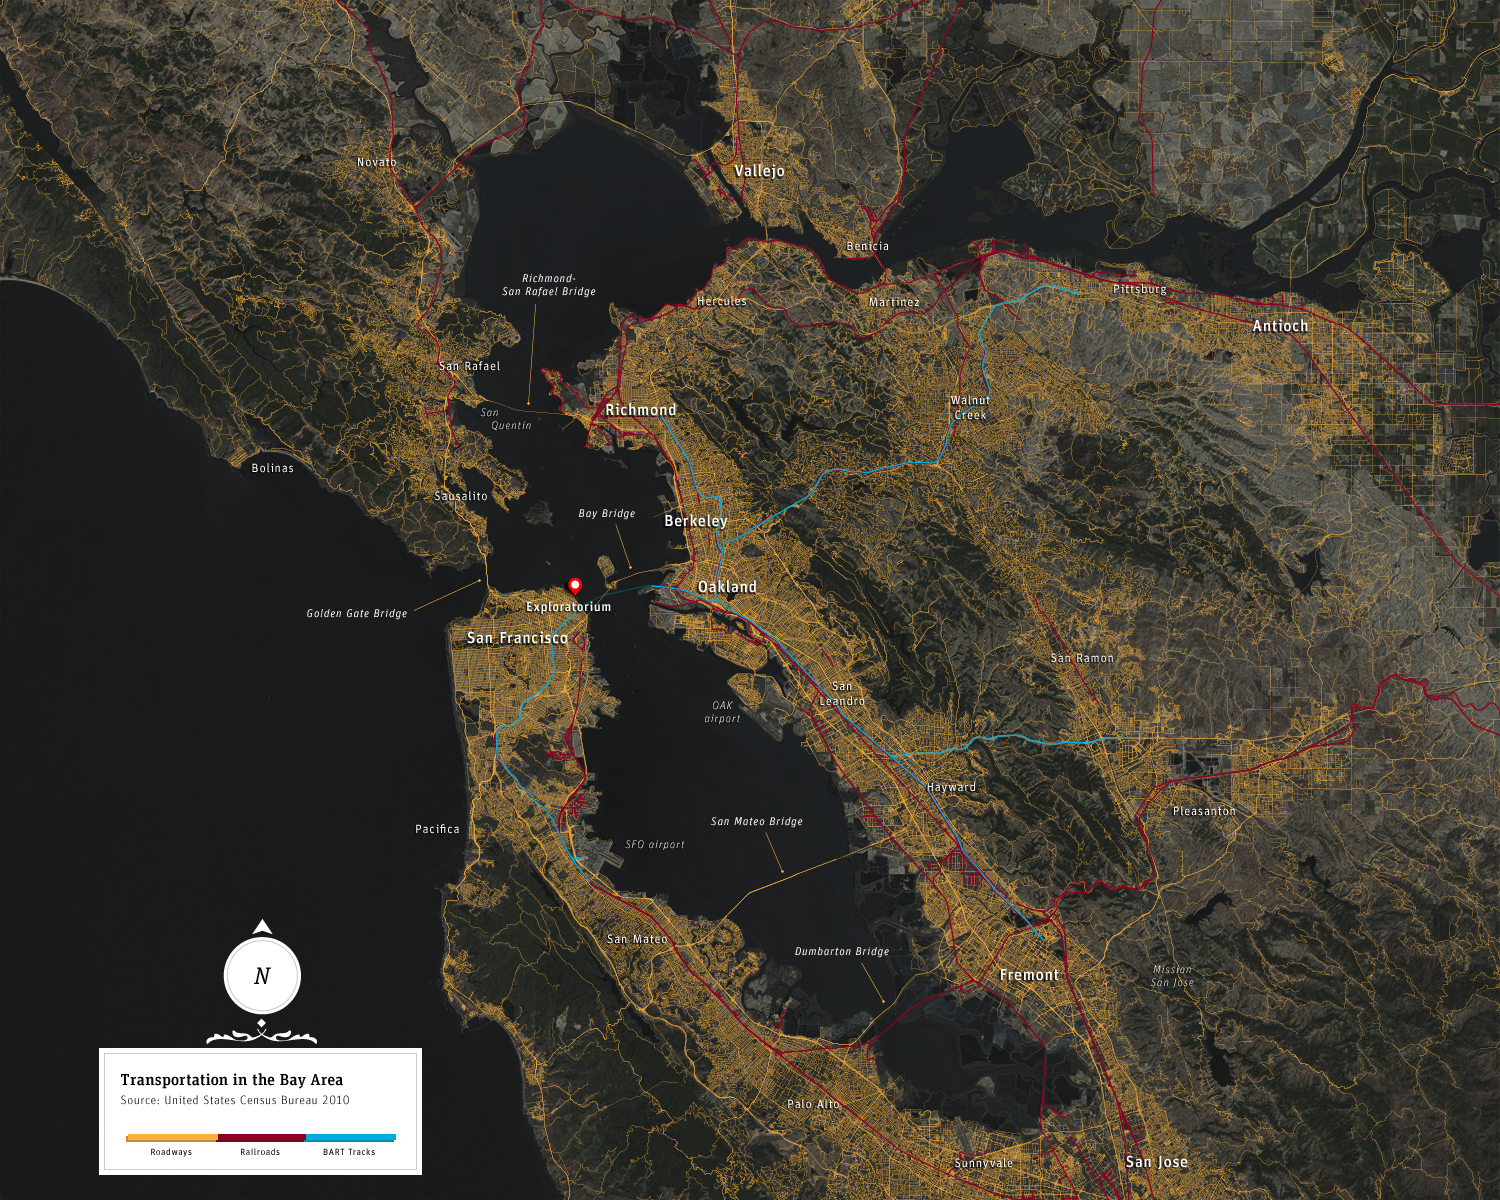
The Sequence: This visualization walks the viewer through what different zones of risk are in areas that are susceptible to liquefaction, then displaying the areas we have to readily settled, concluding on infrastructural phenomena in relation to the fault lines and direction of crustal deformation.